Launch event discussed scenarios of applying the Viabundus dataset
by Nina Dengg, Team Magdeburg
The update covers additions as well as corrections and smaller refinements.
For Denmark the information for some ferries and settlements have been added and the documentation for the Danish part is now available.
Viabundus Applied – where do we go from here?
Viabundus has been around for more than a year now and it may be rightfully asked what – if any – research has been undertaken with the data we released into the world. With this thought in mind we held our second update-event „Viabundus Applied“, organised by our NL-team coordinator Maartje A.B., in which we invited several speakers to give an insight into their application of the Viabundus dataset. As it turns out, Viabundus has been used in a very diverse set of works!
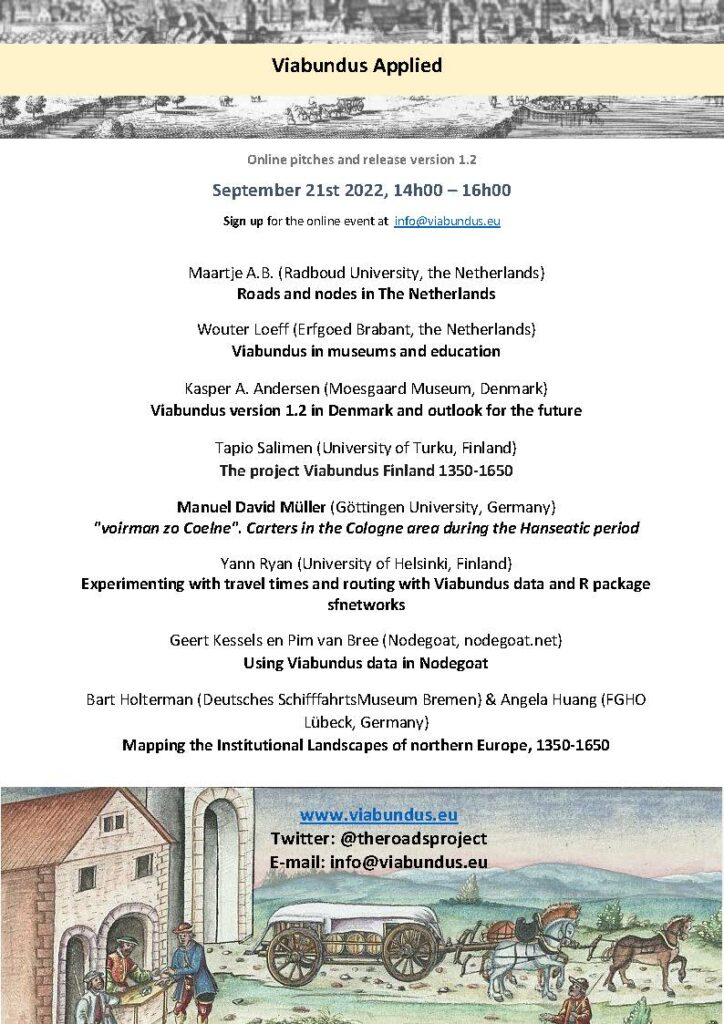
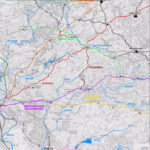
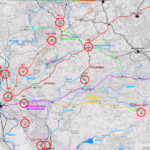
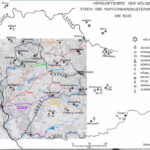
By having a close look at our map in the area of Cologne,Manuel David Müller was able to identify contemporary road names and their corresponding tolls. This way, he could quite follow the carters in the Hanseatic period he was looking at for his M.A.-thesis at the University of Göttingen. You can see his presentation here:
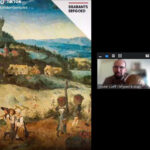
We are especially proud of the work of Erfgoed Brabant, who not only added data on the Dutch region of Brabant but also opens the Viabundus data to a broader public. As Wouter Loeff explained to us, it is their aim to create a personal experience with history and for this, viabundus is a great way to connect with the past. This approach was used in schools and museums so far and they hope to expand it even more! Have a look at their website.
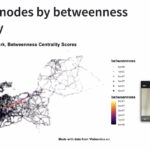
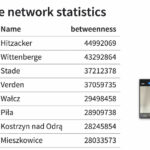
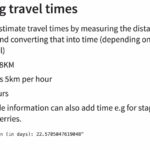
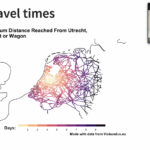
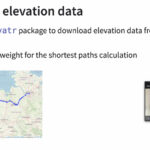
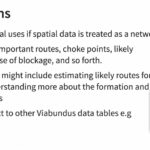
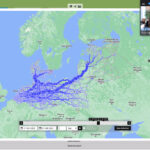
Several approaches connect the dataset with network analysis, which is quite especially encouraging, as the collected data is based on a network idea. Yann Ryan used the data in R and the package sfnetworks and came to colourful results.
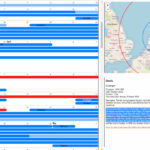
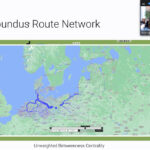
Geert Kessels and Pim van Bree showed us the potential of Viabundus-data in their handy research environment nodegoat by giving us a live show of how to set up the data model and perform analytics. The results looked similar to Yann’s.
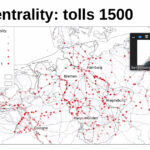
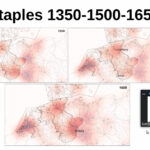
Our very own Bart Holterman and Angela Huang used the network data in GIS to develop questions concerning the centrality of tolls, markets and staples and first results suggest that the importance of these backbones of economy may have been further spread than to the large medieval fairs that are commonly known. With all this data we have to keep in mind that Viabundus’ work is far from complete. This has a direct impact on the results of network analysis, since the resulting graphs only become more accurate the more data is added.
“People came for the map but stayed for the story“
Wouter Loeff said in regards to the success of Erfgoed Brabant’s tiktok-presence, but we hope we can say the same for all the people who join us on Viabundus’ journey!
